Table of Contents
Introduction
I’ve lived in the Deep South for a few years. It can get pretty humid here. But usually, by the time October and November roll around, the air dries out. Winters are usually pleasant for this transplanted northerner, and even if the dewpoint temperature rises during the cool season, it remains tolerable. But in the past few days, the rate at which the humidity was changing made me take notice.
Moisture in the Morning
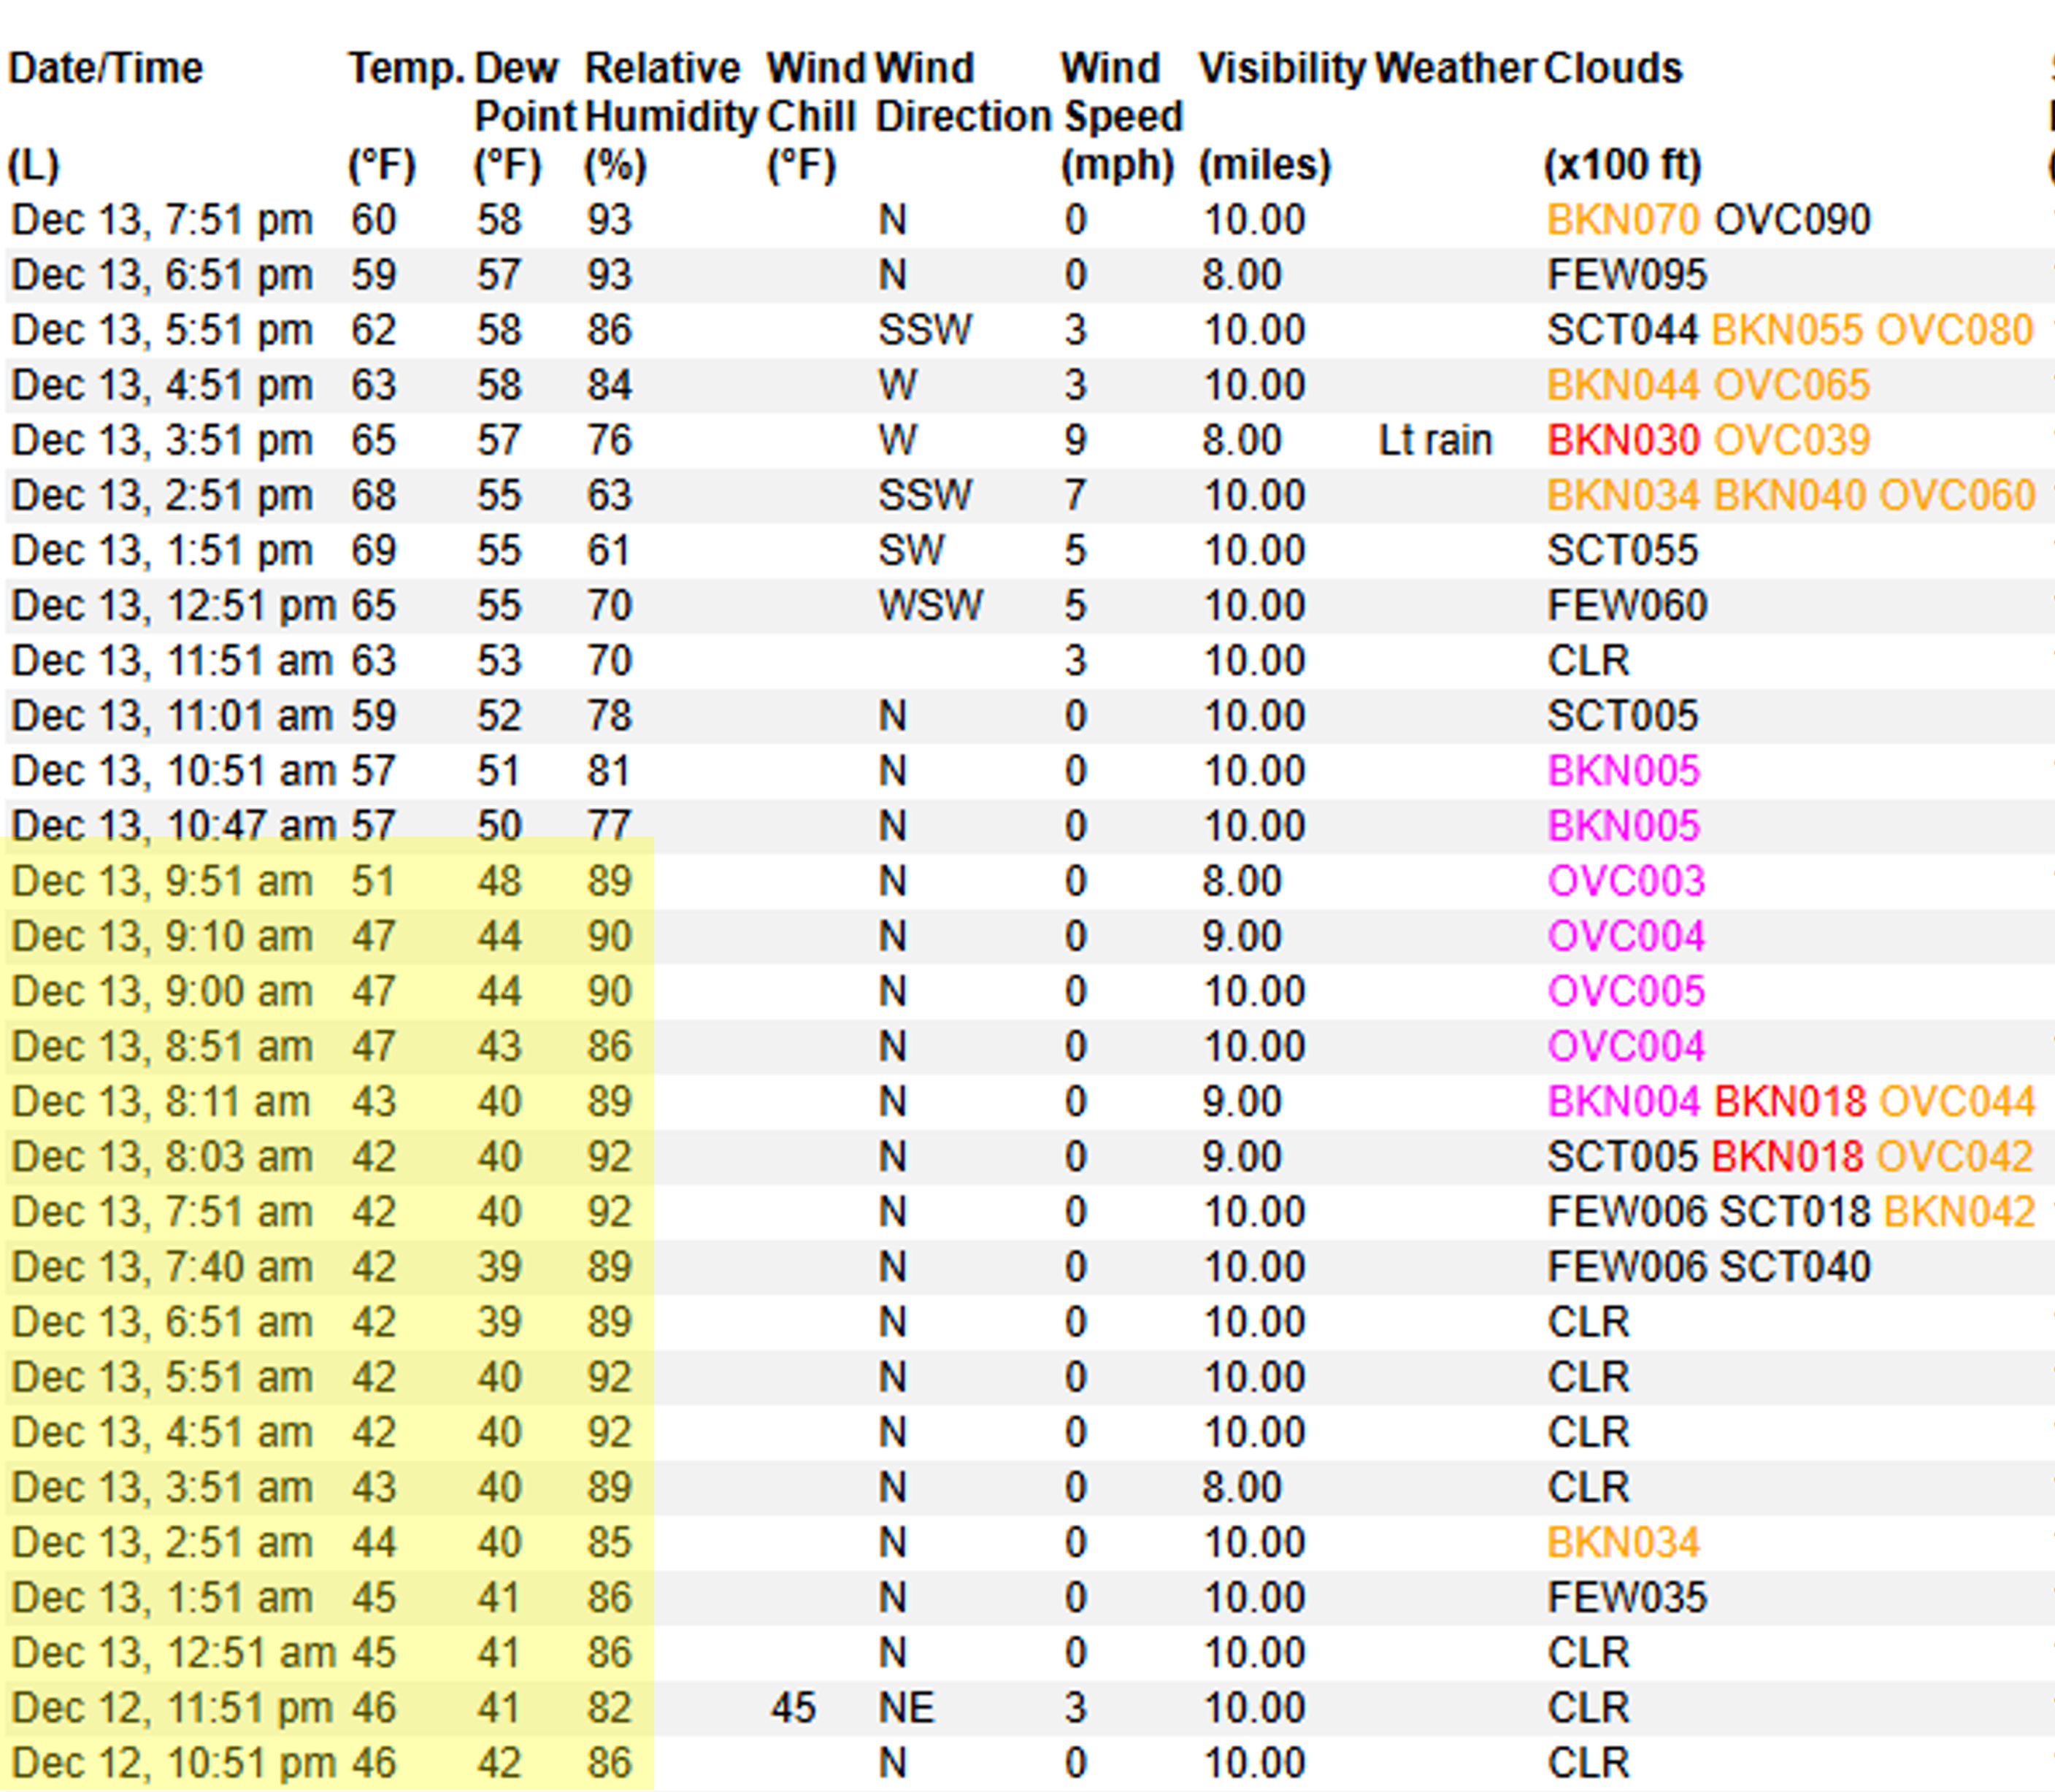
I became aware of this humidity change on my computer monitor before I felt it. On Saturday, December 13, I was checking the weather observations from the local airport. The air temperature was rising…and for once, the dewpoint temperature was keeping pace. In the yellow highlighted region on the data table below, the relative humidity remained between 85-92% from overnight well into the morning as the surface warmed.

Source: National Weather Service
The warming lagged behind the 7:33 am sunrise, with the air temperature holding steady for more than half an hour before rising itself. As the temperature then increased from the low 40’s Fahrenheit into the 50’s, the dewpoint temperature kept pace with air temperature. Such a rapid morning increase in dewpoint, particularly in concert with the air temperature, is unusual here in Columbus, Georgia. At the same time, low-level clouds rapidly grew in coverage, with multiple layers appearing before an overcast briefly settled a mere few hundred feet above the ground. The animation below depicts the evolution of this cloud cover by translating encoded observations at 5-minute intervals into imagery.

Local standard time and cloud reports are given at upper left.
Data Source: IEM ASOS Archive
Dewpoint Rise on a Typical Morning
In the morning, the air temperature usually rises much faster than the dewpoint temperature because air temperature responds immediately to the radiative input from the sun, while moisture responds through slower, multi-step processes. After sunrise, solar radiation rapidly warms the surface, and sensible heat flux increases almost at once, raising air temperature in the shallow layer of nocturnally-cooled air near the surface.
Dewpoint temperature, by contrast, depends on the addition or redistribution of water vapor, which requires evaporation from soil, vegetation, surface water, or dew, followed by turbulent transport upward. Those processes cannot accelerate as quickly as temperature because they are constrained by surface moisture availability, phase-change energetics, and the initial stability of the near-surface layer. The result is that the air temperature rises first.
Note: The password-protected section below is meant to streamline this post for readers who aren’t necessarily interested in the gory details. If you’re just reading for fun, skip ahead to the next section. If you’re a weather weenie, feel free to enter the password below and read more. If you have entered this password on another post, the content is already unlocked. You may also want to read my process-based framework for more background on the four types of atmospheric processes and how they interact, which will provide useful context for this section.
Password: weatherweenie
Atmospheric Processes Governing the Morning Transition
The Morning Transition in the New Climate Regime
I’ve been paying careful attention to weather patterns since I noticed striking changes in cloud appearance and organization in November. Since then, I’ve been hyper-vigilant in observing the atmosphere by following local air and dewpoint temperature changes, taking some measurements in my backyard, watching the clouds, and following larger-scale weather patterns. To me, it all adds up to one conclusion: the atmosphere is organizing differently than it used to. I am not overly alarmed by this development, but I’m watching carefully and following it with a great deal of curiosity.
When I saw the air and dewpoint temperatures rise in concert on December 13, I took it as yet another piece of evidence that might indicate exactly how the atmosphere is realigning. In this case, the low-level clouds appear to be the key clue that explains how the dewpoint was able to keep pace with the air temperature and rise so quickly. Specifically, I suspect that on this day, the near-surface moisture was being added from the clouds above, rather than from the ground below.
Layered cloud formation requires a deep layer of saturation, and that requires high relative humidity. On December 13, the relative humidity remained above 85% throughout the lowest 1 km of the atmosphere. A measured relative humidity of 80% or higher is generally a reasonable threshold for cloud formation, given observational limitations. In this case, cloud formation is also supported by a 20-knot low-level jet embedded in this moist air, centered around 800 m above the ground. A sharp moisture gradient connected the moist lowest kilometer to the drier free atmosphere above, as you can see below.

for Birmingham, Alabama 12 UTC December 13, 2025.
Data source: Univ. of Wyoming
The air and dewpoint temperature data are plotted on the skew-T diagram for Birmingham, Alabama below, with a depiction of clouds based on computed cloud liquid water to the right. I’m showing Birmingham rather than the closer Peachtree City, GA station because the Birmingham sounding shows better agreement with the cloud observations in Columbus.

with estimated cloud layers.
Data source: Univ. of Wyoming
The lower cloud layer appears to be anchored to the top of the surface inversion (the inflection point in the temperature line), and the thinner cloud layer above sits at the bottom of the moisture gradient noted on the above figure. The multi-layered cloud structure with a thicker, more persistent layer low to the ground on the right panel of the figure below generally agrees with the cloud observations in Columbus you’ve seen in the animation above.
Before we consider how this cloud layer may have contributed to the rapid surface moistening, we need to consider the bigger picture. We know that the surface dewpoint increase was due to a local process rather than the transport of moisture from elsewhere (such as the Gulf) because the moisture advection was relatively weak, as shown by the map below. More clearly stated, about the same amount of low-level humidity is entering the shaded box (my location) as is leaving it.

Columbus is located on the Georgia border in the center of the shaded box.
Source: Plymouth State Weather Center
The shading of the moisture advection field on the map above indicates values ranging from 0 to 2 × 10⁻⁵ g/kg/s, which is quite modest. If moisture is not being added into the system, how can the local environment increase the surface dewpoint so quickly? I think I have the answer: it’s not generating moisture, it’s redistributing it vertically.
Gently rising air in cloud layers promotes condensation near the cloud base, while weakly sinking air or turbulent mixing below the cloud promotes evaporation. This mixing process introduces repeated cycles of condensation and evaporation, each of which redistributes moisture, more downward than upward, while releasing and absorbing latent heat in slightly different layers.

redistributes moisture vertically.
You can see this clearly by re-visiting the cloud animation from earlier in this post, which I show again below. The upper cloud layers descend as the lowest layer grows. Over time, this acts to homogenize humidity through the lower atmosphere without requiring net import of water vapor. As moist air is mixed downward in this manner, the surface dewpoint temperature inches upward, and the surface air temperature rises jointly with it.

Local standard time and cloud reports are given at upper left.
Data Source: IEM ASOS Archive
Now let’s consider the rapid rise in dewpoint temperature of about 10°F at Columbus over the course of about three hours. If we are a bit generous and interpret this as moistening of a layer from 0 to 0.4 km (the depth of the near-surface temperature inversion), the dewpoint rise corresponds to an equivalent latent energy uptake of 304 W m⁻² over 2.6 hours, which also corresponds to 2.85MJ m⁻².
By way of comparison, the solar constant – the amount of incident solar radiation at the edge of the atmosphere – is typically between 1360 to 1370 W m⁻². Given the sun’s position on December 13 during these morning hours, the estimated clear sky irradiance reaching the ground at Columbus, GA increases from 60 to 460 W m⁻² as the sun rises, yielding roughly 2.6 to 2.7 MJ m⁻² over the same interval.
This implies that the temperature rose relatively slowly while the dewpoint rose relatively quickly on this morning because the system favored moist energy storage over rapid temperature increase, and the magnitude of this energy storage was not altogether different from the amount of energy being added to the system by sunlight. However, we can’t say that the sunlight is being converted to moist energy…it’s merely enabling its redistribution.
I invite you to take a moment to reflect on what we have covered so far. Please evaluate my argument and consider whether it makes sense before moving on to the next section.
Implications for Forecasting in the New Climate Regime
I believe this process shows a key property of the new climate regime. In a previous post where I described some rapid changes in cloud appearance and structure, I noted that the cloud formation appeared to be evaporating from the inside out, rather than outside-in. A similar organizational principle appears to occur here: the moisture is being redistributed from within the system, rather than being brought in from the outside. This implies that meteorologists may need to change their understanding of how weather patterns and storm structures organize.
An important question that follows is: will it be easier or more difficult to diagnose these changing organizational structures, especially in severe and hazardous weather contexts? I believe it will depend on each given scenario.
On the one hand, the rapid rise in surface dewpoint illustrates that there is the potential for conditions to unwind more quickly than usual, so it is possible that some situations may escalate more rapidly than we are used to. At the same time, these escalations are more likely to come from within self-contained systems, rather than due to forcing from the outside. The time scale at which severe and hazardous weather emerges from these self-contained systems when an external trigger occurs may shrink, but in many cases it may be possible to anticipate these triggering events.
This set of constraints will require some adjustment, but I believe forecasters and people will adapt. And as I will explain in the next section, it’s possible that sometimes our physiology may not be able to keep pace with the evolving thermodynamic state of the atmosphere, which could make things a bit uncomfortable.
Why It Feels More Humid than It Is (and a Caveat about Rapidly Evolving Conditions)
And now for the more human part of the story…how I felt in the ensuing hours after the dewpoint rose so quickly. I wasn’t uncomfortable, but the air felt much more humid than it really was. I was thinking the dewpoint was in the low 60s Fahrenheit when in reality it was 10 degrees lower. It felt as though the summer humidity was setting back in.
And this was for good reason. The human body is adapted to slower evolutions in weather conditions than the short-term adjustments that are now possible. As the climate regime shifts, it may get warmer…or colder… more quickly than has typically been the case. This is because atmospheric processes at different scales can pair together more quickly, accelerating short-term rates of change. While the weather may temporarily change at a faster clip, the metabolic activity of the human body is geared respond to these changes at a certain tempo.
If weather changes exceed the body’s ability to compensate, it can get uncomfortable for the person in the meat suit. If humidity rises too quickly, the body’s ability to regulate its internal temperature by evaporative cooling from the skin is suddenly less efficient relative to the prior state. The nervous system interprets this as “stickiness” or heaviness, even though the absolute vapor pressure remains low. In effect, the body is responding to the gradient, not the endpoint. And it takes time for the body to catch up.
In the case of the Intermountain West in the U.S. on December 19, 2025, conditions were ripe for another type of rapid change: downsloping winds as strong winds descend mountain slopes. Adiabatic compression as air descends can make the air temperature rise and the dewpoint fall at a relatively rapid rate at the surface, especially when winds are strong. During a wintertime downsloping event in Spearfish, South Dakota, the temperature changed by 56 °F during a student’s walk to her local college campus, as was noted in this excellent YouTube video by The History Guy.
The rapid drying of near-surface air induced by downsloping winds can quickly create dangerous conditions: one spark carelessly ignited can set off a wildfire, and under these conditions this fire can intensify and spread quickly. In the new climate regime, it will be critical for people to remain vigilant in anticipating to when sensitive atmospheric environments are in place, and to be careful not to ignite a hazardous situation.
Implications for Outdoor Activities and Human Comfort and Safety
I’m going to close with some thoughts on how to prepare for a more changeable atmosphere. As the climate continues to evolve, everyday weather is likely to feel less intuitive even on days that do not appear extreme on paper. Temperature, humidity, and dewpoint will not always line up with how the air feels on your skin or in your lungs. Conditions may linger in awkward middle states, neither clearly dry nor clearly humid, neither fully cooling nor fully warming, which can make people feel unusually tired, sticky, chilled, or overheated without an obvious cause. This does not mean the measurements are wrong, but that the atmosphere is spending more time out of balance while it adjusts.
To prepare, it helps to rely less on single numbers and more on patterns and context. Pay attention to recent conditions, such as whether the air was very dry or very humid the day before, because sudden changes matter more to comfort than absolute values. Plan clothing, hydration, and outdoor activity with flexibility in mind, and expect that evenings may cool more slowly and mornings may feel heavier than they used to. Ventilation, shade, and airflow will matter as much as temperature, and moisture management, both personal and indoors, may become more important.
In most cases, the most useful adjustment is mental rather than technical. Expect some degree of variability, ambiguity, and surprise, and treat discomfort as a signal of transition rather than failure. However, people will also need to be aware of when careless actions can spark a dangerous situation, particularly with wildfire hazards. The atmosphere is not merely getting warmer or wetter; it is also becoming more expressive and less predictable in how energy and moisture move near the ground. Preparing for that reality means staying observant, adapting routines as conditions evolve, and letting go of older rules of thumb that no longer consistently apply.
Want to receive future posts related to this study in your inbox? Be sure to subscribe to this blog using the “Newsletter” link at upper right.
This work is made possible by those who believe in it. Thank you for considering a gift to help ensure its continued momentum.
Author’s Note: This summary is freely available for educational use. Please cite “Jessup, S. (2025). It Isn’t as Humid as It Feels: The Meteorology of Surface Dewpoint and Human Adaptability in a Changing Climate” in scholarly work.